Deep Value Investor
We seek investment opportunities that trade at a discount to readily ascertainable valuations and are often contrarian or special situation in nature
Balance Sheet Focused with a Long-Term Horizon
Third Avenue’s investment philosophy demands financial strength, which enables our portfolio holdings to both endure challenges and grow value over time
Focus on Total Return
Our goal is to provide above-average performance, most of the time and over the long term, while seeking capital preservation through investing in companies that typically have tangible assets that are often difficult to replicate; the Fund may serve as a non-correlating element to more mainstream value strategies
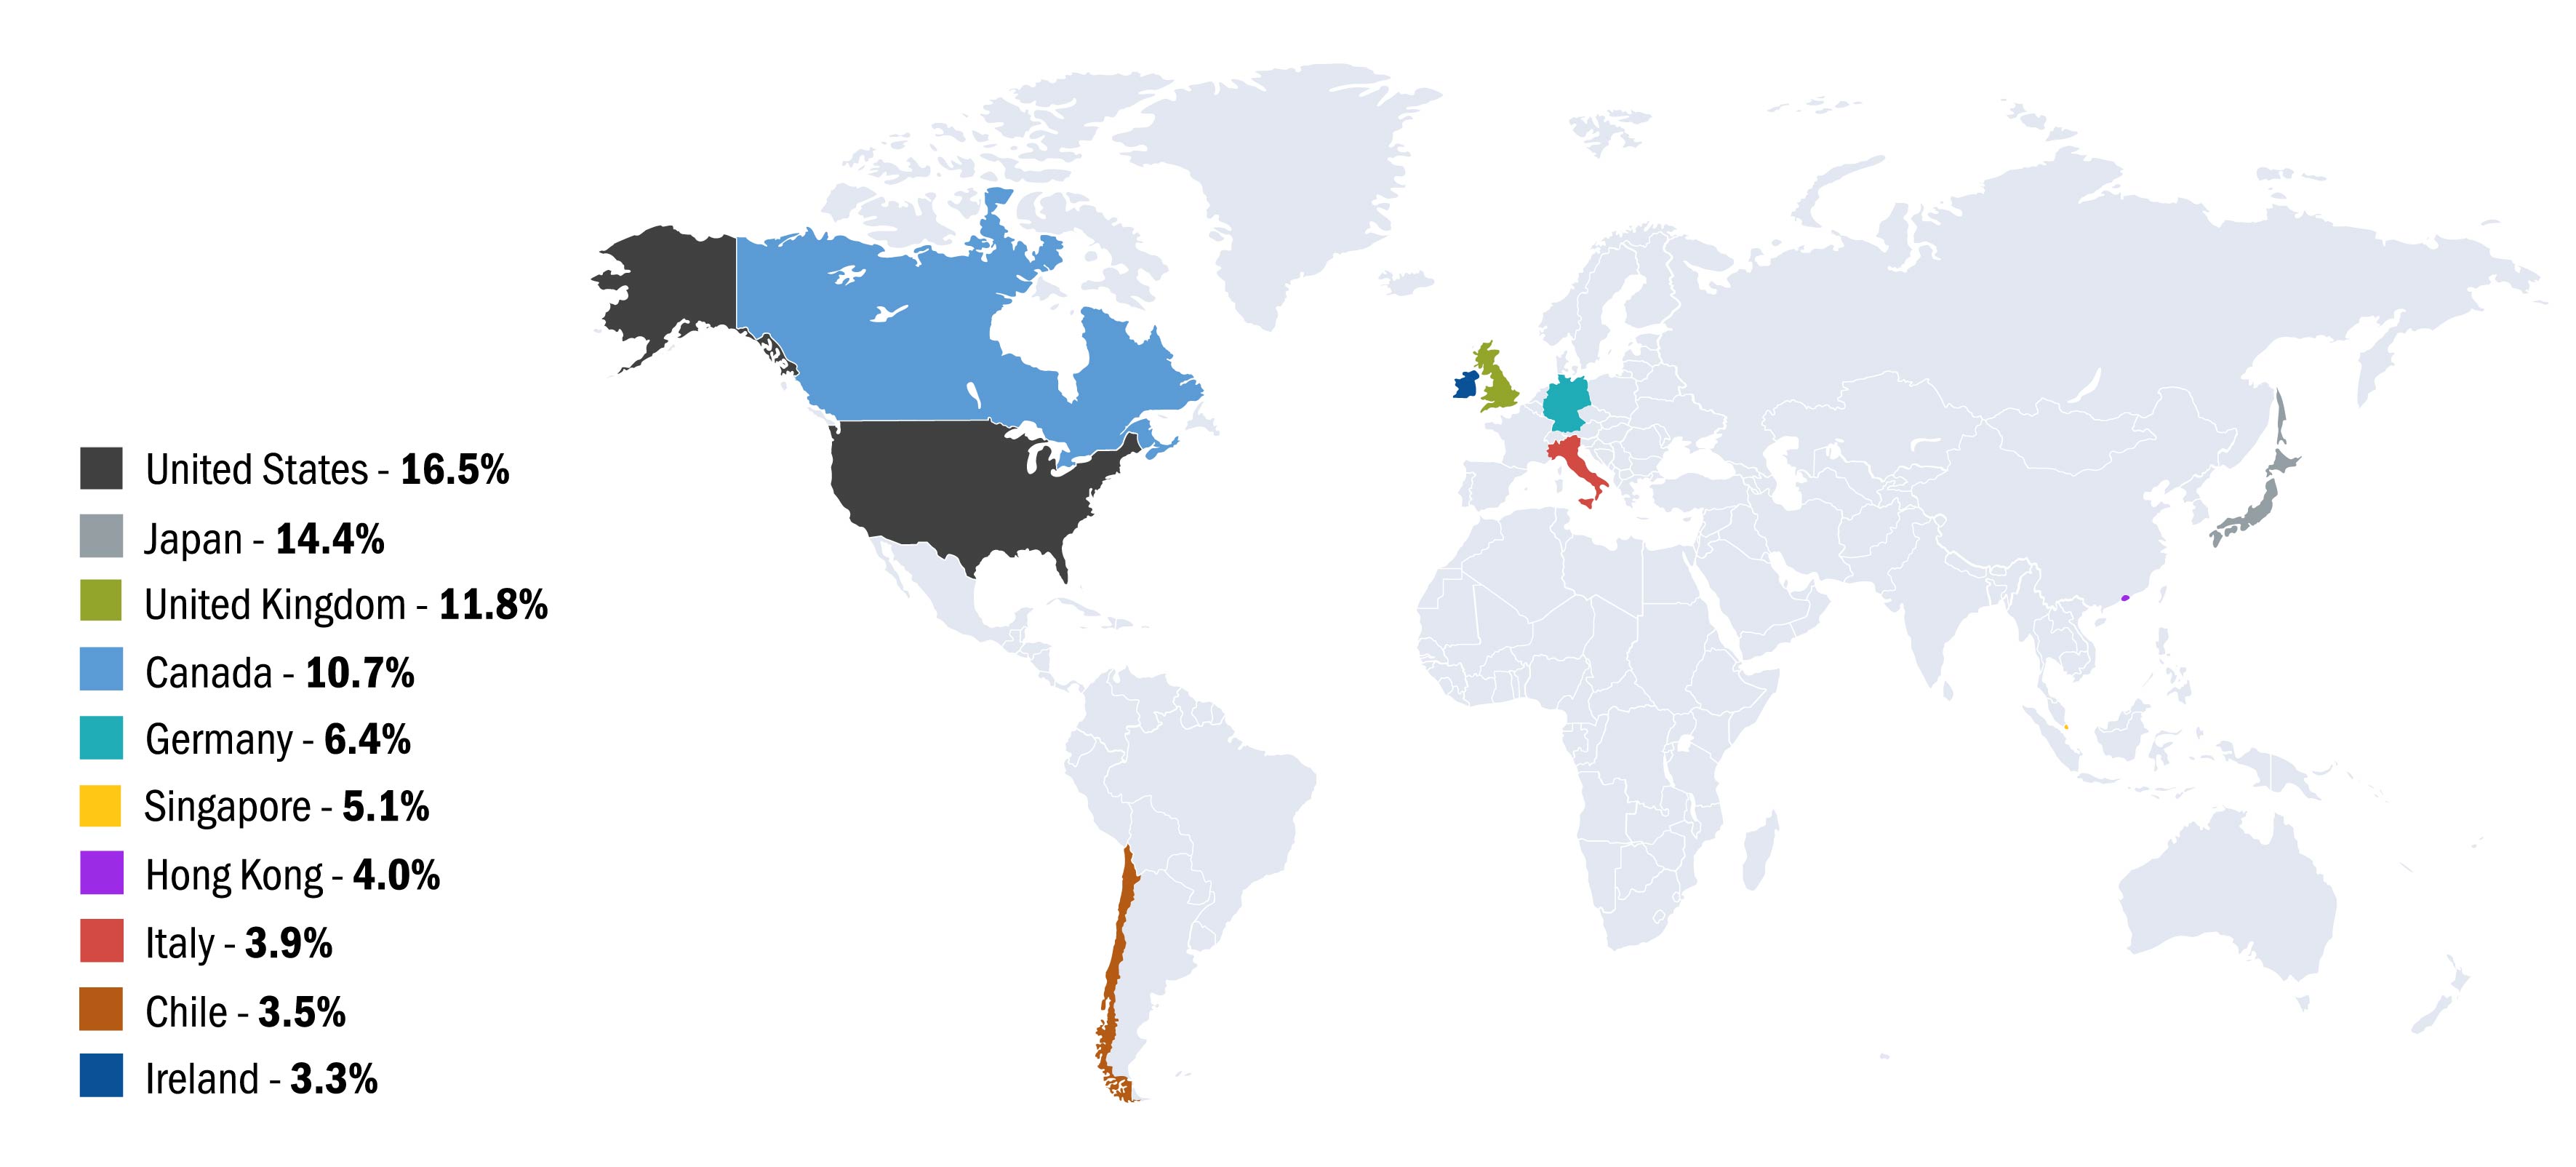
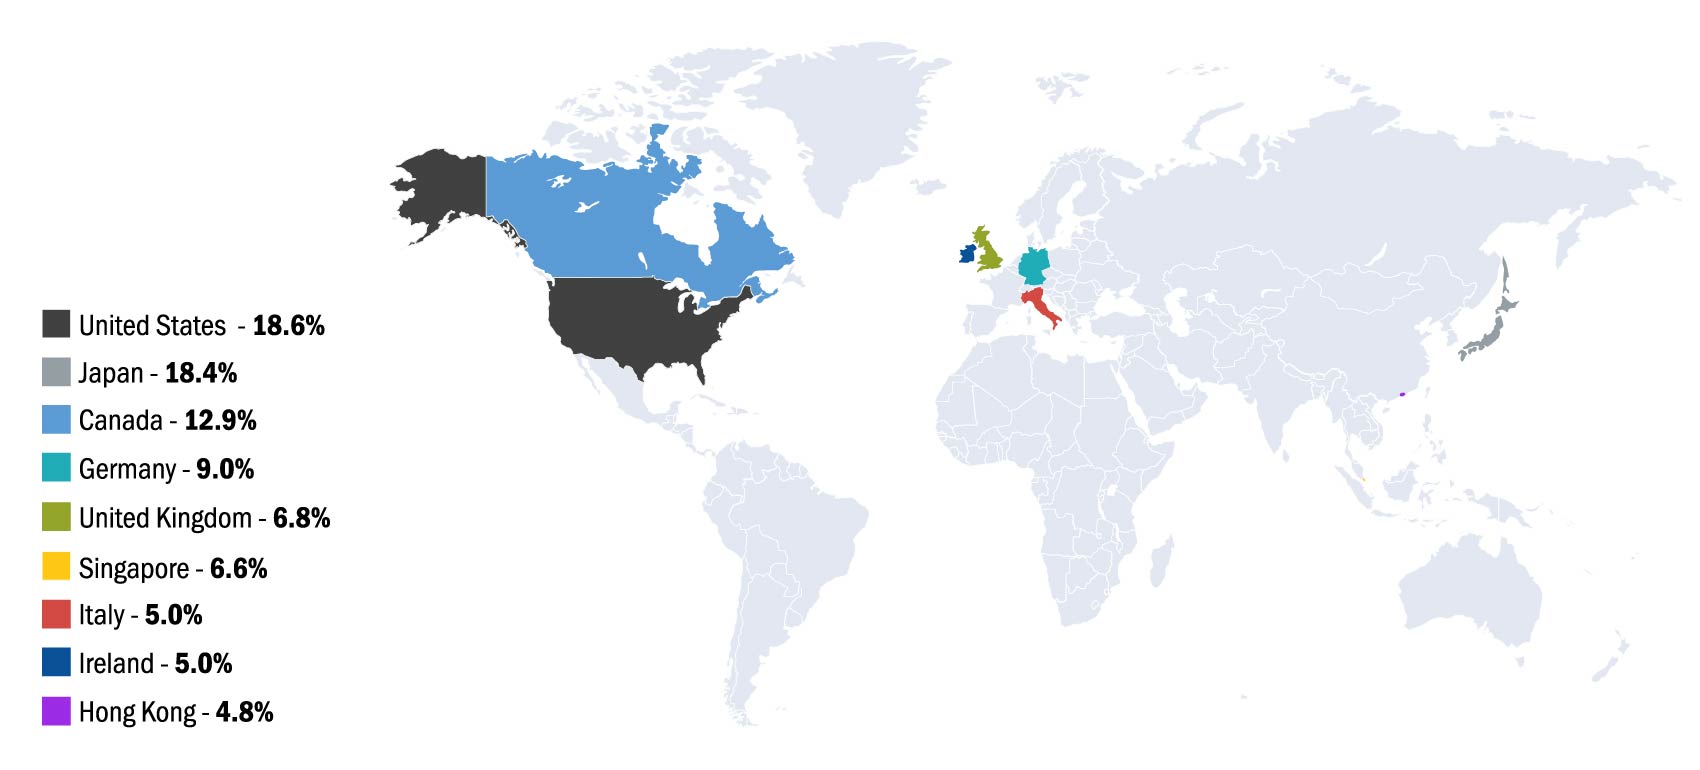
Global Universe
Our approach is globally opportunistic, finding value in economic and industrial recessions, complex corporate structures or capital structures and special situations in both developed and emerging markets
High Conviction, Active Portfolio Management
We actively manage the portfolio by prudently concentrating on our highest conviction ideas, and by holding cash when there are fewer buying opportunities